
Try the method in how to test reaction time. Keep the task and input settings visible when comparing results.
What belongs in a reaction time lab report?
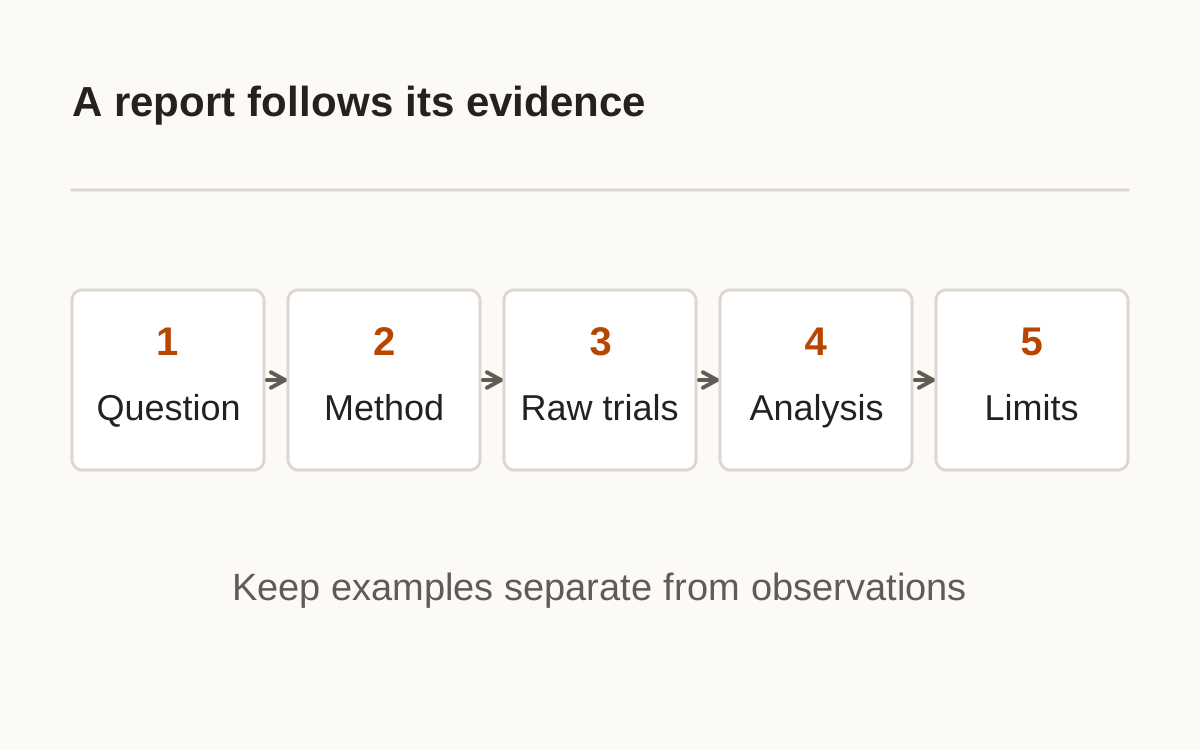
A reaction time lab report connects a question to a repeatable method, genuine observations, analysis, and a limited conclusion. Explain what you expected before seeing results, the interval measured, and trial-acceptance rules. “We tested reactions” omits the detail another reader needs to understand the procedure.
Use the blank CSV log below for your own observations. Its columns are condition, trial, time_ms, false_start, and notes. Empty rows contain no data. Keep device, input, cue, protocol, and planned trial count in a method note. The template is a recording aid, not a completed experiment or ready-made student submission.
- State the planned question.
- Define cue, response, and setup.
- Record real observations and errors.
- Show calculations and limits.
How should a reaction time lab report separate examples from observations?
Label a worked calculation as synthetic before its numbers appear. Keep it separate from collected observations. An example can teach the analysis without pretending that an experiment or participant session occurred.
Download the blank reaction-time trial log (CSV)
The original paper describes its own simple-response task and equipment calibration. Its measurements are not norms for this browser protocol. Woods and colleagues: Factors influencing the latency of simple reaction time (2015).
Reaction time experiment control variable: what stays fixed?
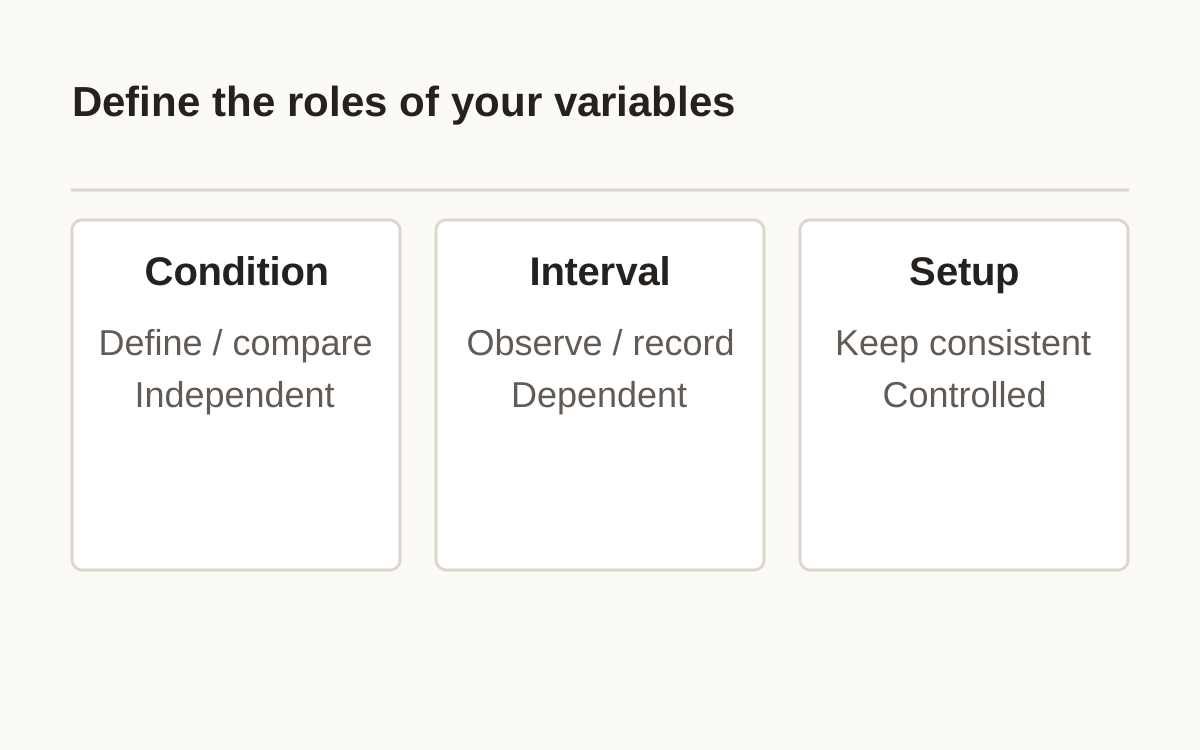
A control variable is a condition kept consistent while examining a comparison. Browser input, instructions, cue type, display, and trial count can matter. Specify what stays fixed and which condition differs. If several settings change together, the result cannot be attributed to just one.
A safe illustrative comparison can contrast documented task procedures. This guide does not propose changing sleep, medication, alcohol, or stimulant use. Follow appropriate supervision and local requirements for classroom or participant work. A ruler activity needs a defined release and catch method, and its inferred physical interval differs from software event timing.
| Role | Example |
|---|---|
| Independent condition | Documented task compared |
| Dependent observation | Measured interval |
| Controlled setup | Device, input, instructions, trial count |
| Irregularity | Early response or interruption note |
NASA describes a partner-assisted drop-and-catch activity. Keep its physical procedure distinct from a browser signal task. NASA: Measure Your Reaction Time.
Reaction time experiment hypothesis: how can it be testable?
A testable hypothesis names a comparison and observable outcome before collecting results. For example, a report could examine whether two specified task protocols produce different correct-response medians in the recorded sessions. Preserve the actual tasks and sample rather than claiming to measure a person’s whole ability.
Choose exclusions in advance. A slow value should not disappear simply because it weakens the expected pattern. Retain the raw record and exclusion reason. If no valid timed observations remain, report that instead of replacing missing data with zero. This outline provides no results for your hypothesis and should not be presented as an experiment you conducted.
How should you present results, uncertainty, and a conclusion?
Synthetic calculation only: 200, 220, 240, 260, and 280 ms total 1,200 ms. The mean and median are 240 ms and the range is 80 ms. These invented teaching values are not visitor observations or measurements you collected. Apply transparent calculations to your real valid trials when available.
Report trial and error counts, summary, and spread. Discuss limits such as a small series, task familiarity, setup changes, and uncalibrated physical timing. Answer the original question at the scale the observations support. A personal series alone establishes neither causation nor a population norm; incomplete or unexpected findings still belong in an honest report.
Frequently asked questions
Can I use the synthetic numbers as collected results?
No. They are examples and must not be presented as measurements you took.
Is there a blank trial log?
Yes. Download the plain CSV log linked in the method section.
Should I delete a slow result because it looks wrong?
Apply predeclared validity rules and retain the reason for any exclusion.
Can the guide choose a medical or drug experiment?
No. It avoids interventions involving health, medication, alcohol, caffeine dosing, or sleep loss.
Does a small personal series prove causation?
No. Discuss design limits and avoid conclusions beyond the observations.
Sources and method
- NASA: Measure Your Reaction Time · checked 2026-10-21. Read within its original procedure; this site’s examples and rules are separate.
- Woods and colleagues: Factors influencing the latency of simple reaction time (2015) · checked 2026-10-21. Read within its original procedure; this site’s examples and rules are separate.
Published October 21, 2026 · human-reactiontimetest.com · Report a correction