
Try the method in reaction time test. Keep the task and input settings visible when comparing results.
What does average reaction time depend on?
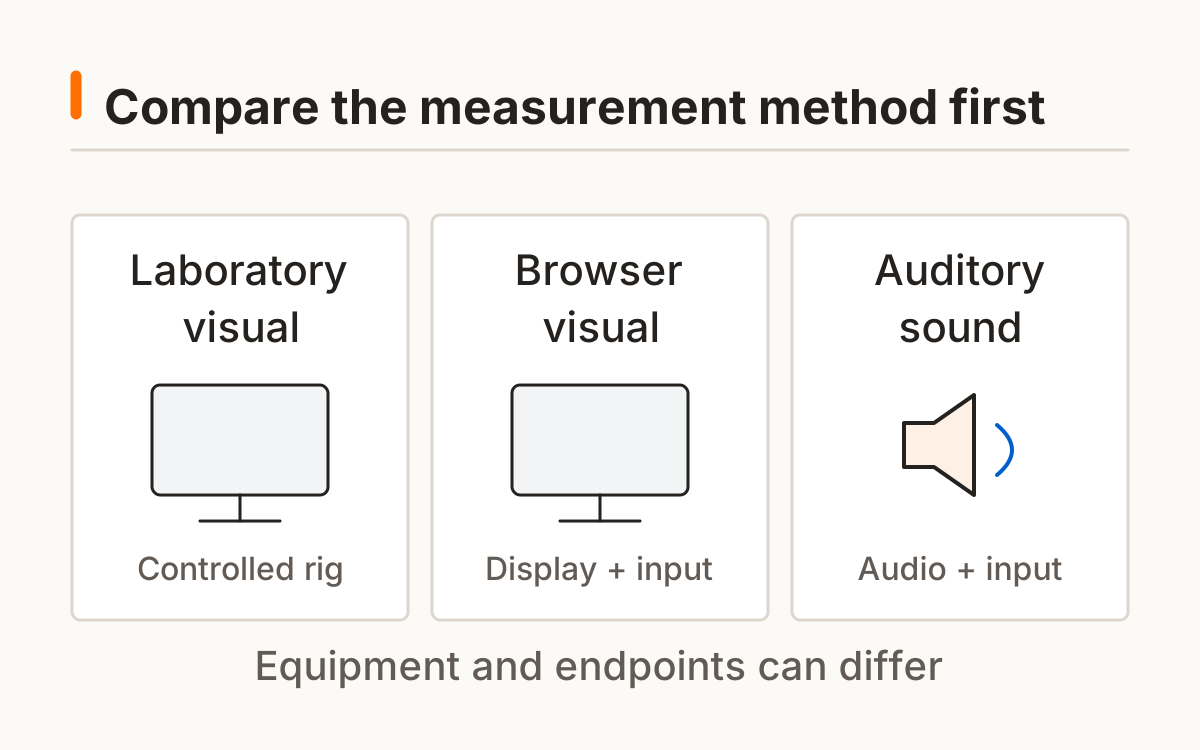
Average reaction time depends on the signal, response definition, participants, and timing setup. A useful average is attached to those details. A visual button task, an auditory task, and a target-acquisition game do not become interchangeable because all report milliseconds.
A personal five-trial average describes that small series. A study average describes the recruited sample under its procedure. Neither alone establishes a universal target for everyone using this website. Start by identifying what the statistic actually summarizes.
Average reaction time can summarize one person’s trials or summarize person-level means across a sample. These are different levels of analysis. Check which level a source reports before applying a group figure to an individual trial.
How should average reaction time handle slow trials?
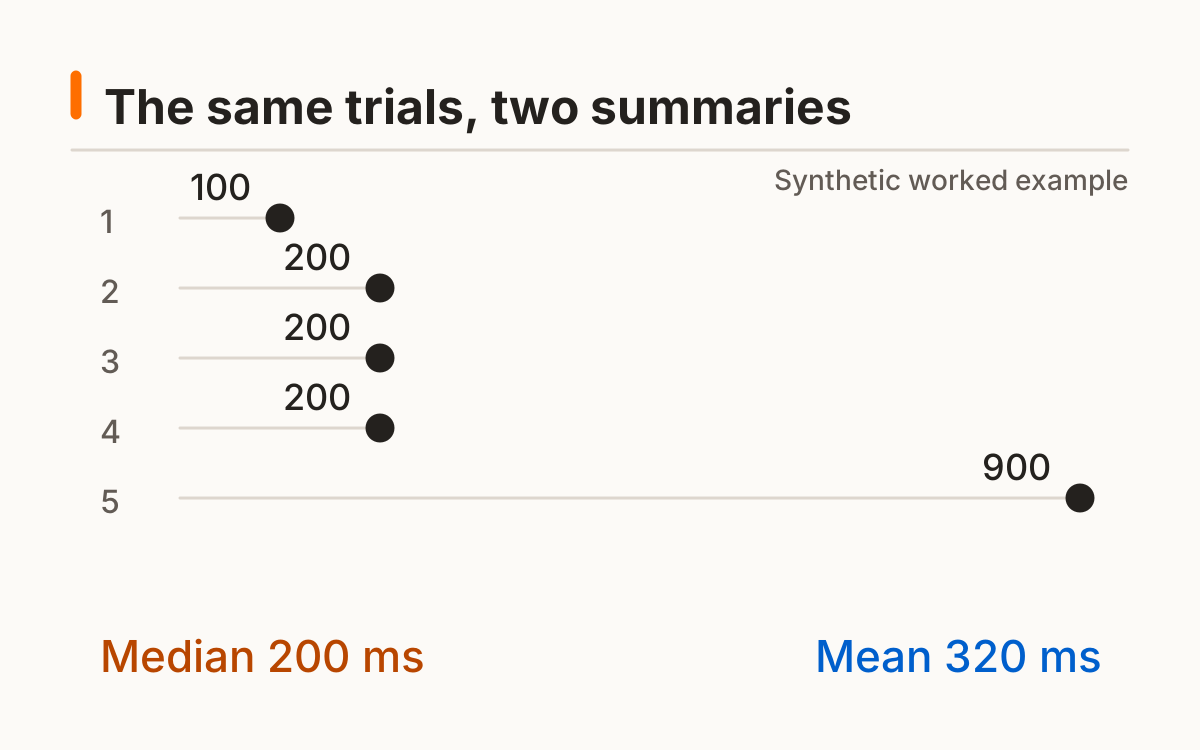
Show slow valid trials rather than deleting them after seeing the result. In a synthetic five-trial set of 100, 200, 200, 200, and 900 ms, the mean is 320 ms and the median is 200 ms. An explicitly invalid interruption is a different issue from a valid but slow response. State exclusion rules before making a comparison.
For research context, this original paper describes its own simple-response methods and equipment timing. Its findings do not calibrate this browser task. Woods and colleagues: Factors influencing the latency of simple reaction time (2015).
Average human reaction time: can studies be combined?
Average human reaction time should not be formed by pooling unlike study numbers without a defensible method. Different samples and tasks may measure different intervals. Preserve whether a value is a participant-level mean, a median, or a summary across people before comparing it.
The Woods and colleagues paper is a source for method-specific simple-response research, rather than a permission to label browser users by universal bands. This guide supplies source context instead of transcribing an unchecked numerical population table.
A study-context table remains useful without copied numerical norms because it exposes comparison fields. If a value lacks its method, source, or adjustment status, omitting it avoids an unsupported impression of a universal reference.
| Comparison field | Why it belongs beside a value |
|---|---|
| Study and task | Identifies the signal and required response |
| Sample and exclusions | Shows who the summary represents |
| Input and onset definition | Defines the measured interval |
| Hardware correction | Separates raw from adjusted values |
| Statistic | Distinguishes mean, median, and group summary |
Average visual reaction time: which equipment was used?
An average visual reaction time needs a description of the display and response apparatus. Timing resolution alone does not show that a physical signal onset or button activation was calibrated. A precise-looking software value can still contain device effects.
Keep raw and adjusted measurements distinct. If a source subtracts an equipment delay, do not compare its corrected value directly with an uncorrected browser sample as though the difference were entirely human. This site does not estimate a hidden hardware correction for your device.
Woods and colleagues describe equipment-delay measurements in their own apparatus. A website using a high-resolution clock has not thereby performed that calibration. Timestamp resolution and calibration of the physical chain answer separate questions.
How should you record a personal baseline?
Record a personal average reaction time alongside median, count, raw values, false starts, input, and protocol. Repeat with the same setup and note interruptions or changed conditions. A small series is a snapshot, so several comparable sessions are more informative than one exceptional attempt.
Use the visual tool to collect a baseline and the interpretation guide to think about consistency. No population percentile is calculated here. Until an appropriate dataset and method exist, leaving a population comparison unreported is more accurate than inventing a chart.
Keep an average reaction time baseline as labeled sessions rather than a permanent personal attribute. Inspect raw values when mean and median diverge. A changed input or trial count belongs in the record before interpreting a gain or loss.
Frequently asked questions
Does average mean median?
No; list the statistic used.
Can I compare phone and mouse scores?
Record them separately because the setup differs.
Why is my best result much lower?
A best result selects one trial rather than summarizing the session.
Can published averages diagnose me?
This site does not provide clinical interpretation.
Will the site give a percentile?
Not without a comparable, permissioned and validated dataset.
Sources and method
Woods and colleagues: Factors influencing the latency of simple reaction time (2015). Read this source within its own method; the protocol and synthetic examples on this page describe this site’s implementation.
Published October 20, 2026 · human-reactiontimetest.com · Report a correction