
Try the method in reaction time. Keep the task and input settings visible when comparing results.
How should average reaction time by age be interpreted?
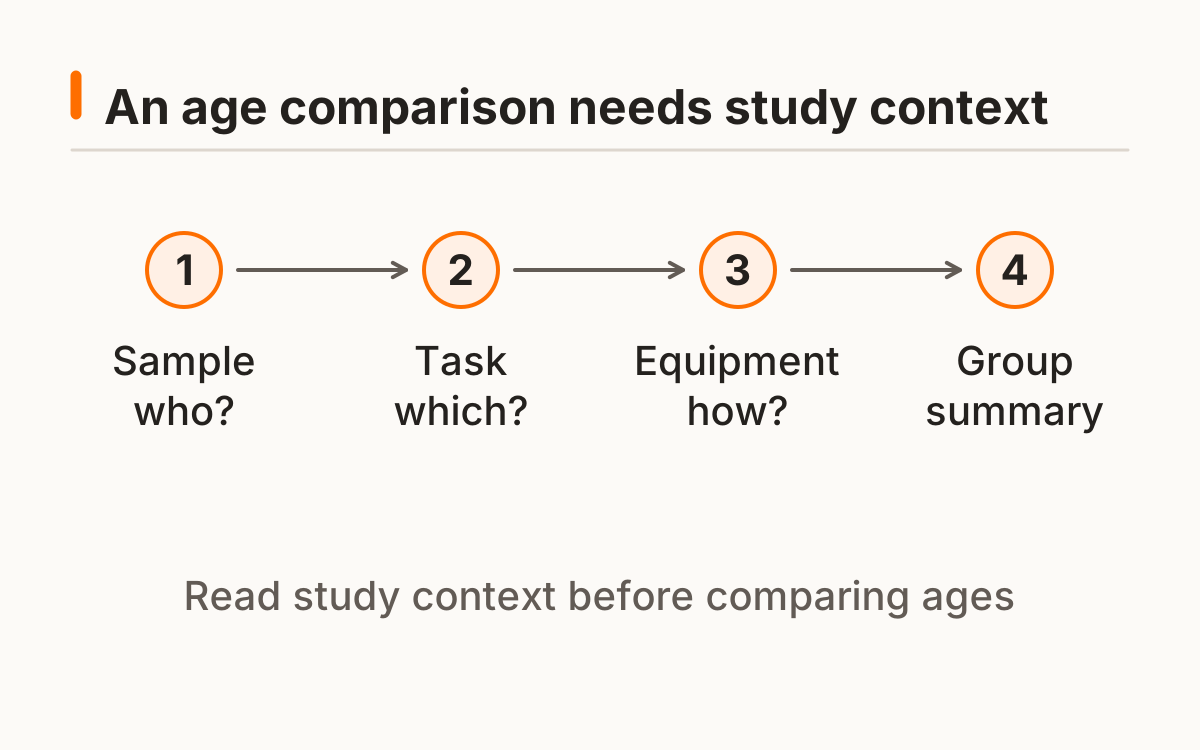
Interpret average reaction time by age only within a named study’s recruited population and procedure. First check what was measured, which participants were included, and how equipment delays were handled. A table without those details may invite a comparison the source does not support.
The Woods and colleagues paper reports age-related differences within its simple-response research. This guide does not turn those findings into per-year browser norms. The illustration shows source context without inventing numerical age bands.
Average reaction time by age is conditional on recruitment and procedure. A different sample or task may not represent the population you have in mind. Keep those limits visible even when a source reports a group association.
Can average reaction time by age predict one person?
Average reaction time by age summarizes groups, not the result of every person in a group. Individual distributions can overlap and study tasks differ. This site does not invert a group trend to estimate your age from a browser score, and it does not classify a score as evidence of decline.
For research context, this original paper describes its own simple-response methods and equipment timing. Its findings do not calibrate this browser task. Woods and colleagues: Factors influencing the latency of simple reaction time (2015).
When does reaction time peak in a particular task?
When reaction time peaks depends on the task and the evidence used to define a peak. A group pattern from one sample is not a universal birthday at which everyone reaches a personal maximum. Do not smooth an unchecked table into a year-by-year prediction.
Check recruitment and age coverage before drawing an inference. A study of adults does not automatically describe children, and different tasks may involve different response demands. This page retains those limits instead of generating a chart beyond the underlying evidence.
A claimed peak depends on age coverage and the statistic reported. This guide does not extrapolate missing ages. A smooth curve can conceal unsupported interpolation rather than add evidence.
How old are your reactions: why is that not calculated?
“How old are your reactions” would require a validated prediction model for the actual browser protocol. This site does not have one. Group associations do not by themselves establish a reliable inverse model for an individual score.
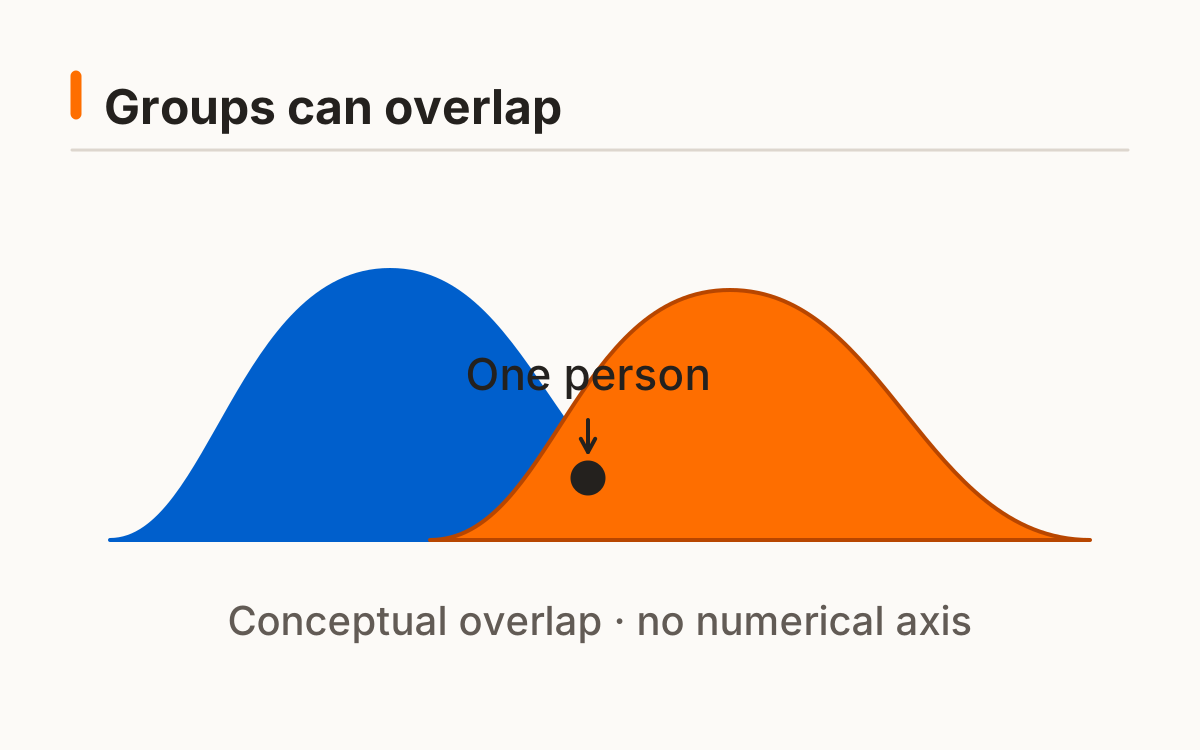
Average reaction time by age also cannot diagnose a condition or explain a personal change without appropriate assessment. Browser timing contains equipment effects, and short sessions contain variation. Use matching sessions to describe your own task performance rather than assigning a reaction age.
A reaction-age model would need validation on the actual input and device conditions. A group association does not supply that validation. Average reaction time by age therefore remains a source-interpretation question here, without collecting your age.
How can you read a study’s age table?
Read a study’s age table by retaining its title, sample, exclusions, task, equipment, correction status, and statistic. Every numerical cell should be checked against the original source. Until that transcription is complete, source context is more accurate than placeholder values.
Compare raw with raw and adjusted with adjusted only when the methods support it. Average reaction time by age should remain a research interpretation question. This site asks for no age or medical information and provides no age calculator.
Raw and corrected values deserve separate columns when an empirical table is transcribed. Keep sample sizes and original sources with each group. Readers should be able to retrace every number rather than trust a scientific-looking graphic.
| Field to check | Question it answers |
|---|---|
| Recruited population | Whom do the groups represent? |
| Sample sizes and exclusions | How were the groups formed? |
| Task and input | Which interval was measured? |
| Equipment correction | Is the value raw or adjusted? |
| Statistic and uncertainty | What summary and variation are reported? |
Frequently asked questions
Can a score tell my age?
No validated model for that is supplied.
Are study averages individual limits?
No; group summaries do not determine individual performance.
Can children use adult norms?
Do not extrapolate beyond the study sample.
Are all studies comparable?
Their tasks, equipment and recruitment can differ.
Will this page diagnose decline?
No; it is an explanation of research comparisons.
Sources and method
Woods and colleagues: Factors influencing the latency of simple reaction time (2015). Read this source within its own method; the protocol and synthetic examples on this page describe this site’s implementation.
Published October 20, 2026 · human-reactiontimetest.com · Report a correction