
Try the method in reaction time test. Keep the task and input settings visible when comparing results.
What makes a good reaction time comparison useful?
A good reaction time comparison matches the task and conditions. Use the same signal, endpoint, device, input, and protocol, and compare summaries from similar numbers of valid trials. This gives a clear personal question: was the measured interval lower or more consistent on this occasion?
A useful result also keeps uncertainty visible. A one-off change may come from ordinary variation, attention, or a changed input path. Good reaction time in this guide means a comparison you can interpret, rather than a fixed band applied to everyone.
A good reaction time comparison starts with the question: typical interval, consistency, or early-response rate? Median, spread, and false starts describe different parts of that question. A useful result keeps all three visible.
Can one trial establish a good reaction time?
One trial cannot establish how consistent a session is. A single quick press may be anticipated or simply unusually fast within your own variation. Several valid trials, their spread, and the false-start count show more of the task. They still do not support an unvalidated label such as elite, impaired, or medically slow.
For research context, this original paper describes its own simple-response methods and equipment timing. Its findings do not calibrate this browser task. Woods and colleagues: Factors influencing the latency of simple reaction time (2015).
What is a good reaction time on the same device?
A consistent personal series is more useful than an unsourced good/bad chart. What is a good reaction time on the same device depends on your earlier comparable sessions and the spread within them. Retain the median and mean instead of grading yourself from the smallest trial.
Review the count and false starts too. A lower median accompanied by many early guesses tells a different story from the same median with no early responses. The browser tool reports these separately so you can see the difference without an invented penalty.
Keep trial counts similar in a personal series. A five-trial baseline and twenty-trial practice block have different sample sizes. Both are useful, but the change should be explicit rather than hidden under the same good reaction time label.
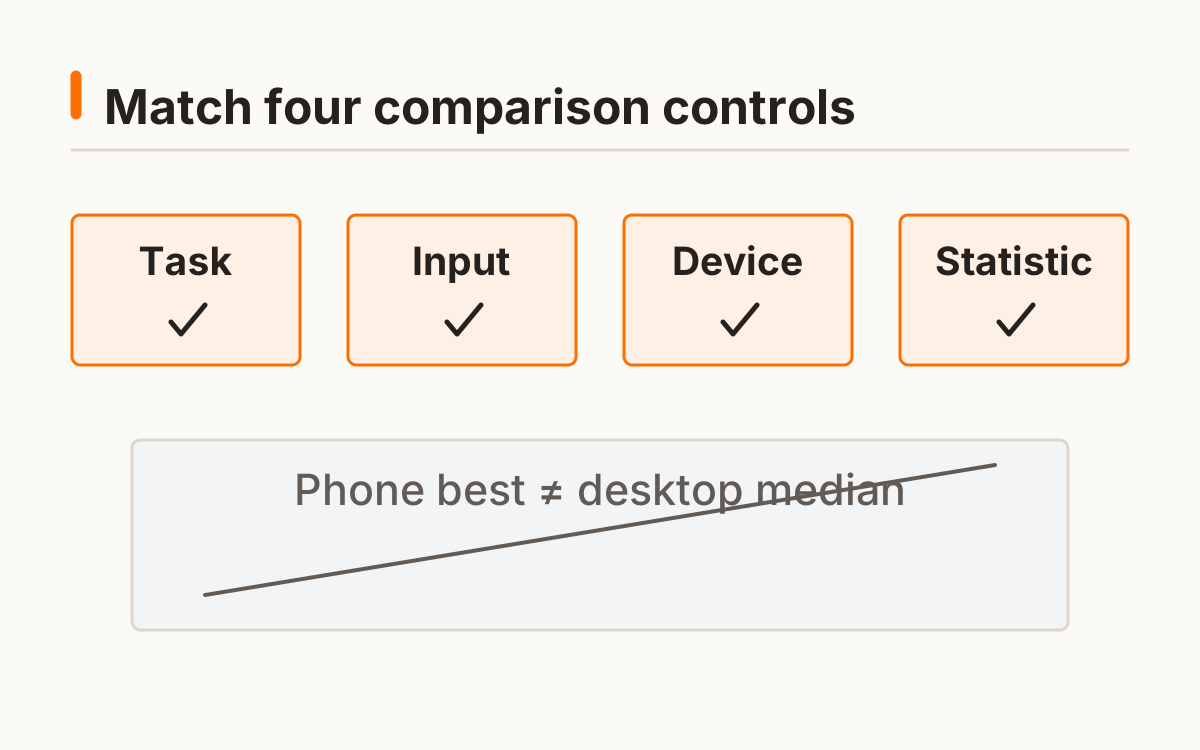
| Keep constant | Record each session |
|---|---|
| Task and protocol version | Median and mean |
| Device and browser | Valid-trial count and raw times |
| Input method | False starts |
| Comparable setup | Notes about interruptions or changes |
What is a fast reaction time relative to your baseline?
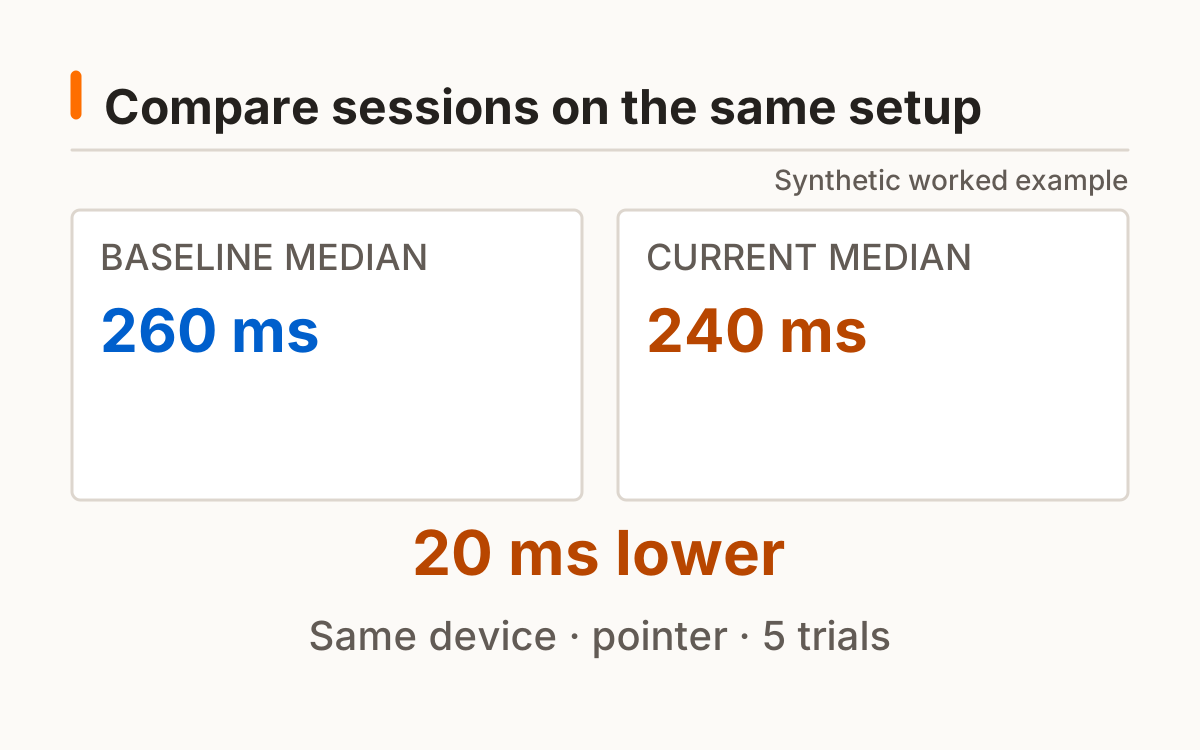
A fast reaction time relative to your baseline means a lower measured interval under comparable conditions. In the synthetic example, a baseline median of 260 ms and a current median of 240 ms differ by 20 ms. That is a 7.69% reduction relative to the baseline.
This arithmetic is not proof of a meaningful physiological improvement. It is a description of two invented session summaries. Real interpretation needs multiple comparable observations and an explanation of what changed. This site does not turn a personal difference into a population percentile.
Subtracting 240 from 260 gives a 20 ms reduction. Dividing it by the baseline gives the relative reduction. This personal arithmetic example does not establish statistical significance, causation, or a general training effect.
When should you avoid a score label?
Avoid a score label when the reference group or procedure is unclear. A good reaction time for one task cannot automatically assess another task or establish competence in driving, sport, work, or health. Source context matters more than an attractive label.
Use the basic tool for a personal baseline or the trainer for structured blocks. If the setup changes, begin a new comparison series. Keep the interpretation limited to what the recorded task supports and avoid diagnosing yourself from this game.
A good/bad label needs a compatible reference and a clear purpose. Without them, it adds confidence without evidence. Keep your report attached to the task rather than using a browser score to decide something about health or competence.
Frequently asked questions
Is 200 ms always good?
A fixed number is not a universal grade across protocols.
Is slower always worse?
The task, accuracy, fatigue and setup all affect interpretation.
Should I compare best or median?
Use the same statistic across comparable sessions; retain the raw trials.
Can the page estimate my age?
No validated reaction-age model is supplied.
When should I stop practicing?
Take a break if you are tired or uncomfortable; no performance target is mandatory.
Sources and method
Woods and colleagues: Factors influencing the latency of simple reaction time (2015). Read this source within its own method; the protocol and synthetic examples on this page describe this site’s implementation.
Published October 20, 2026 · human-reactiontimetest.com · Report a correction